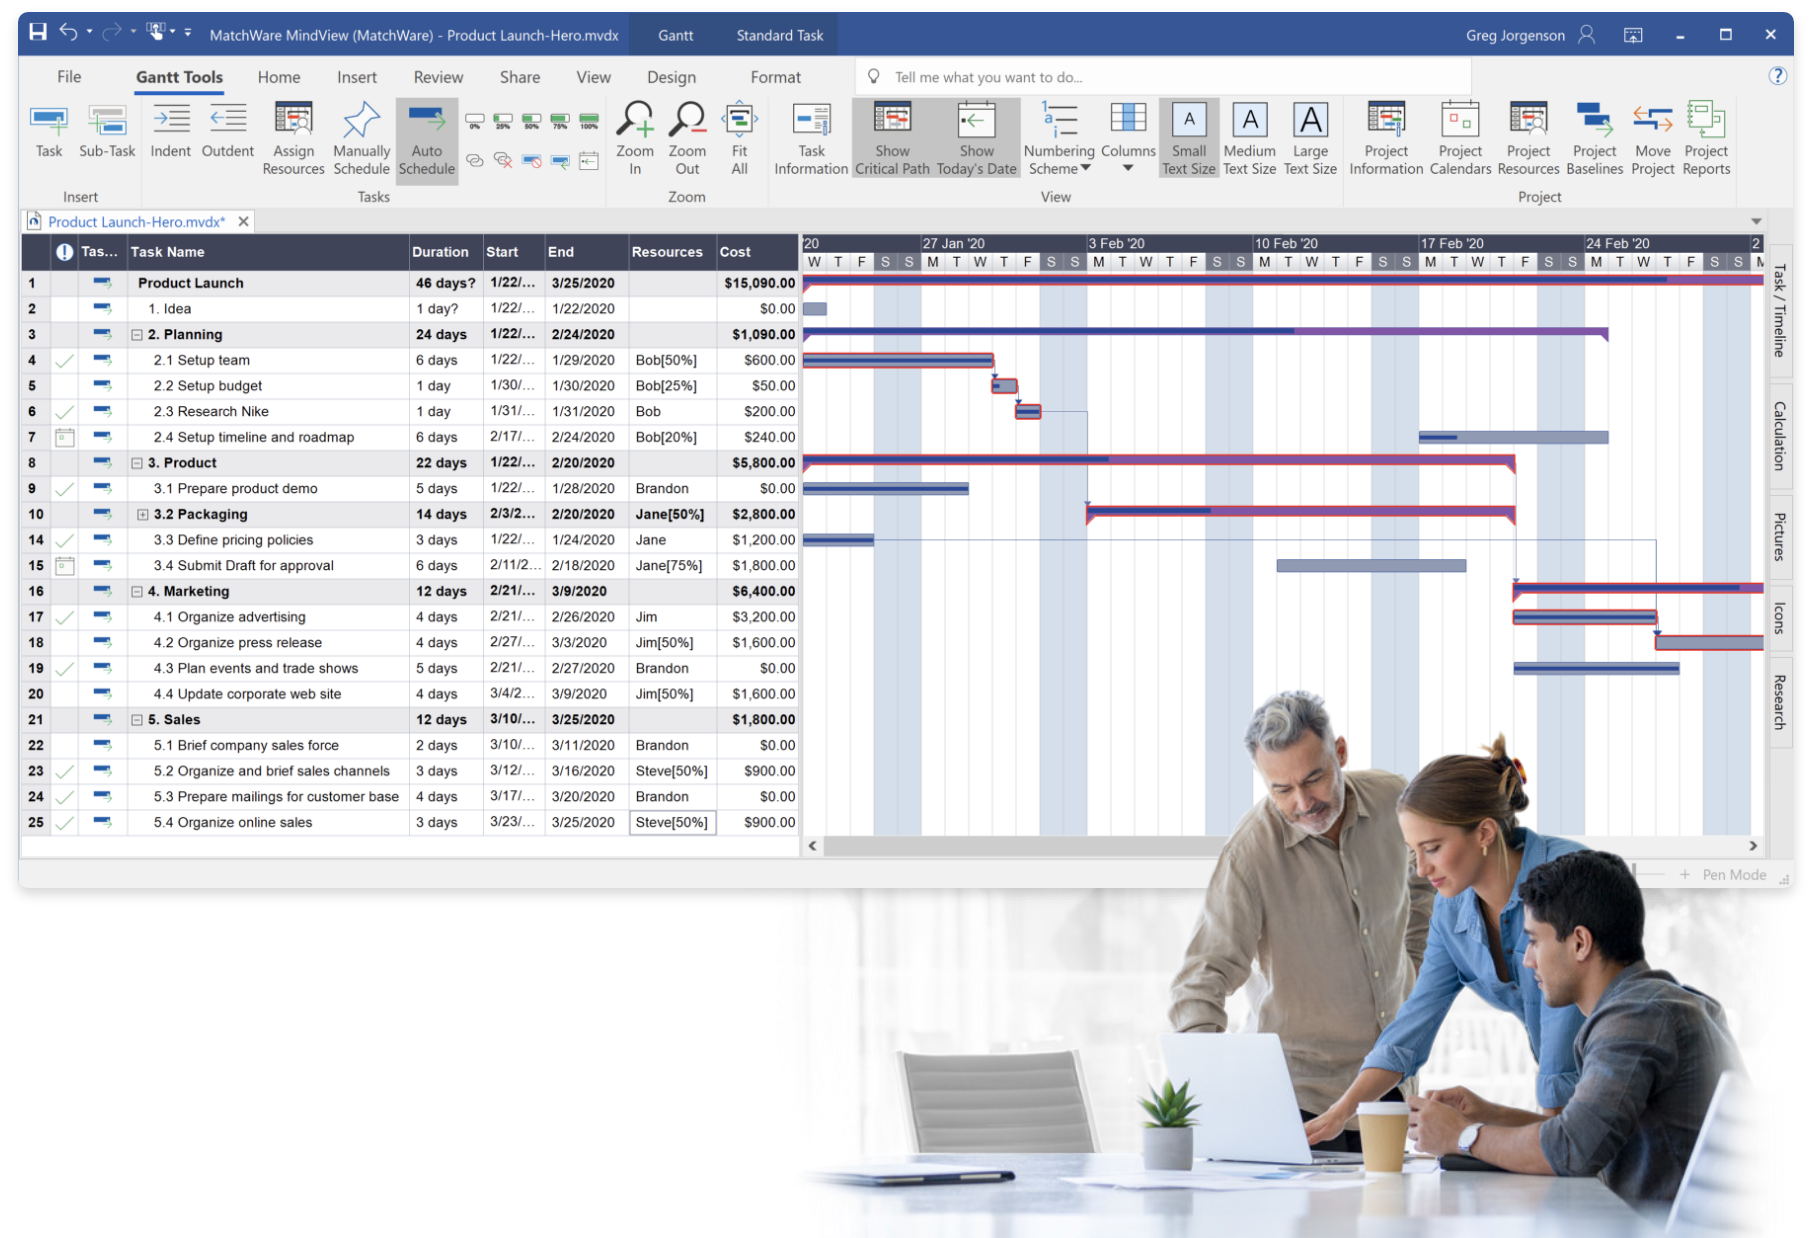
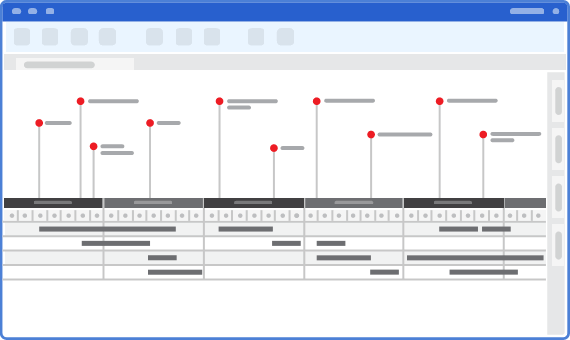
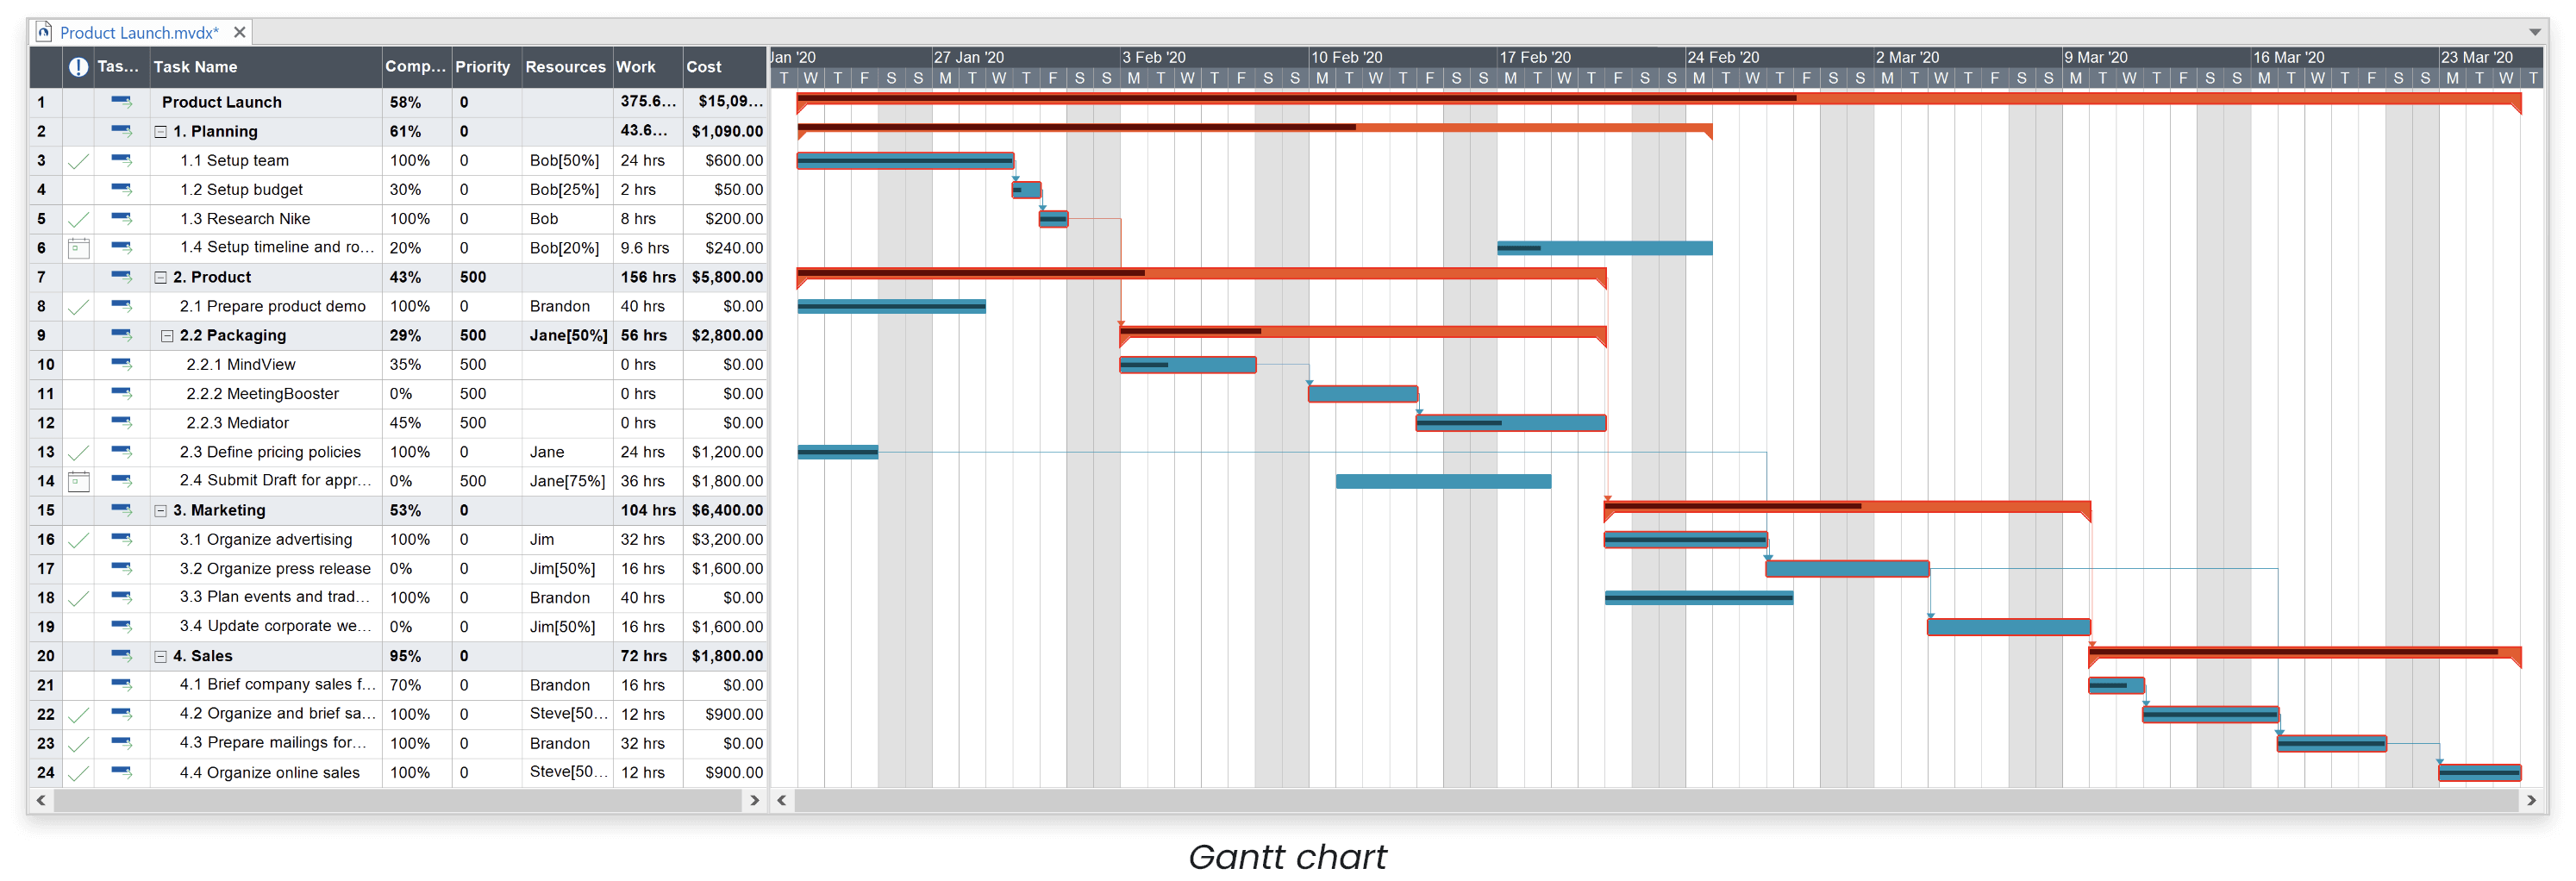
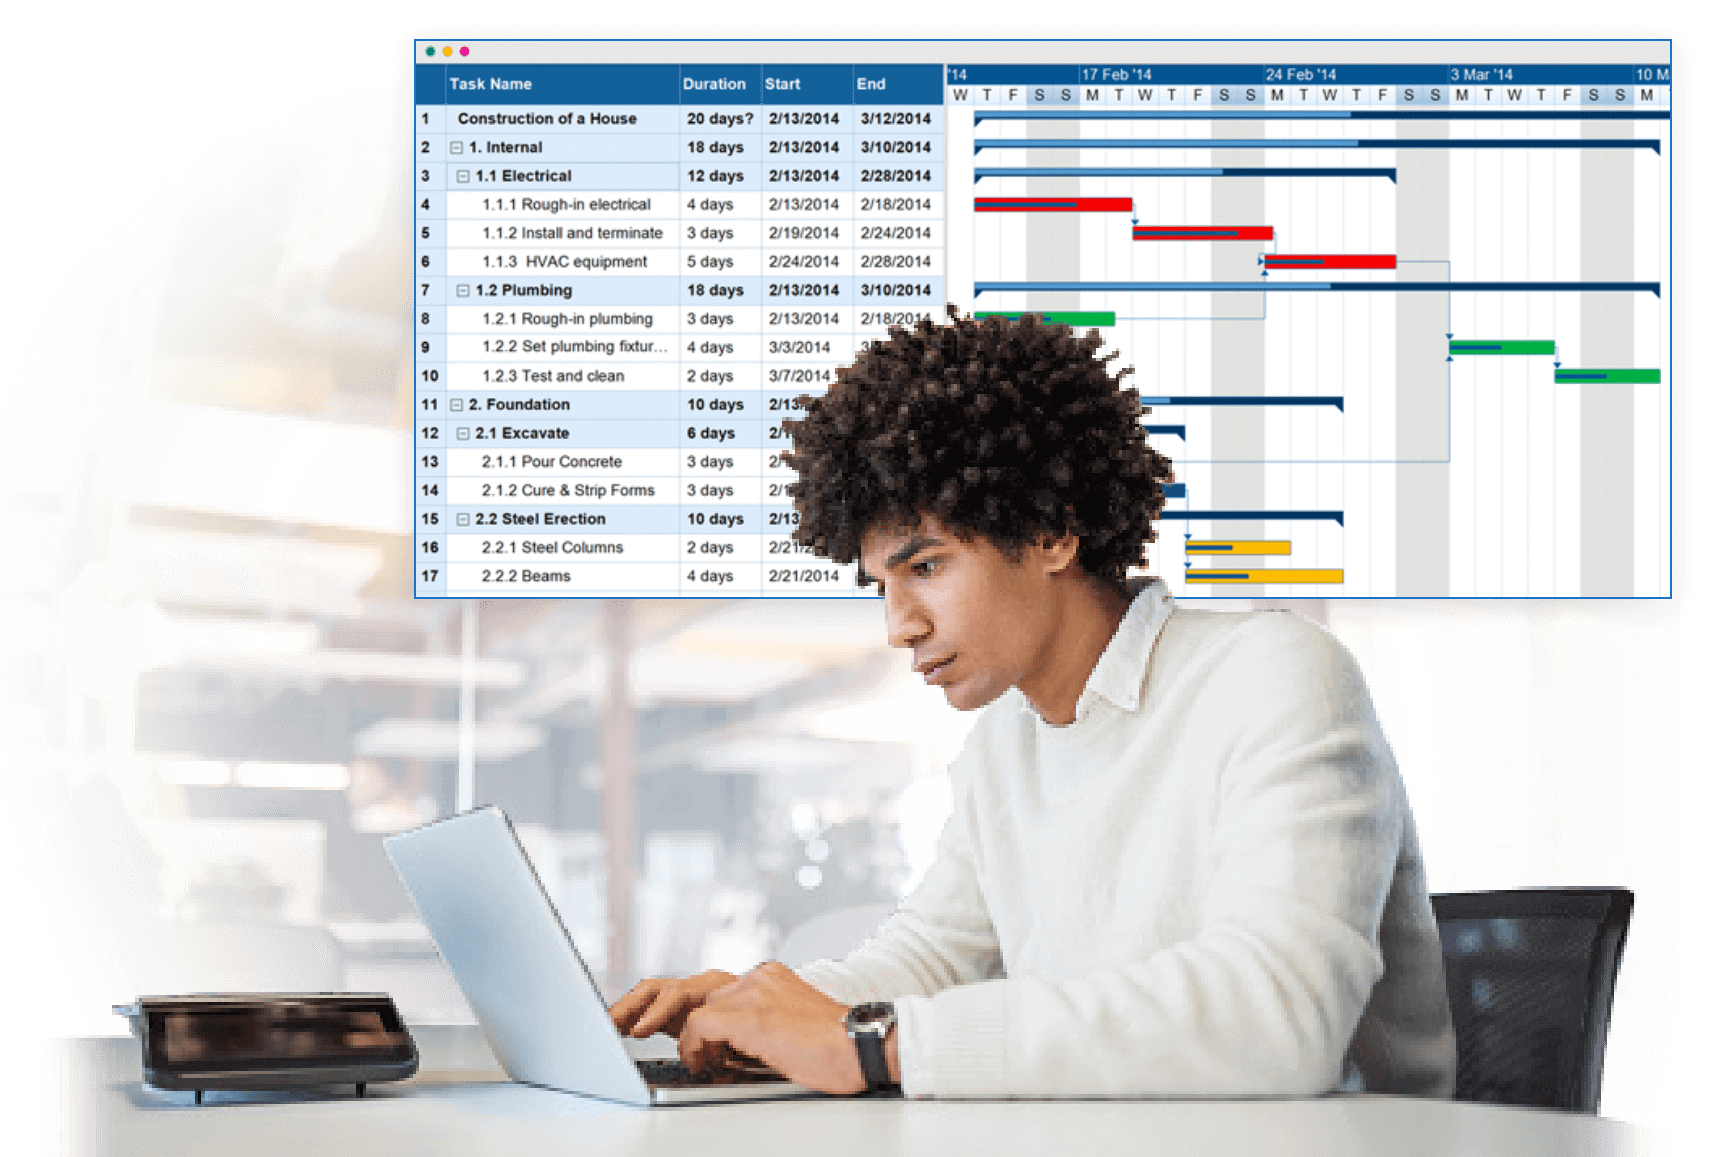
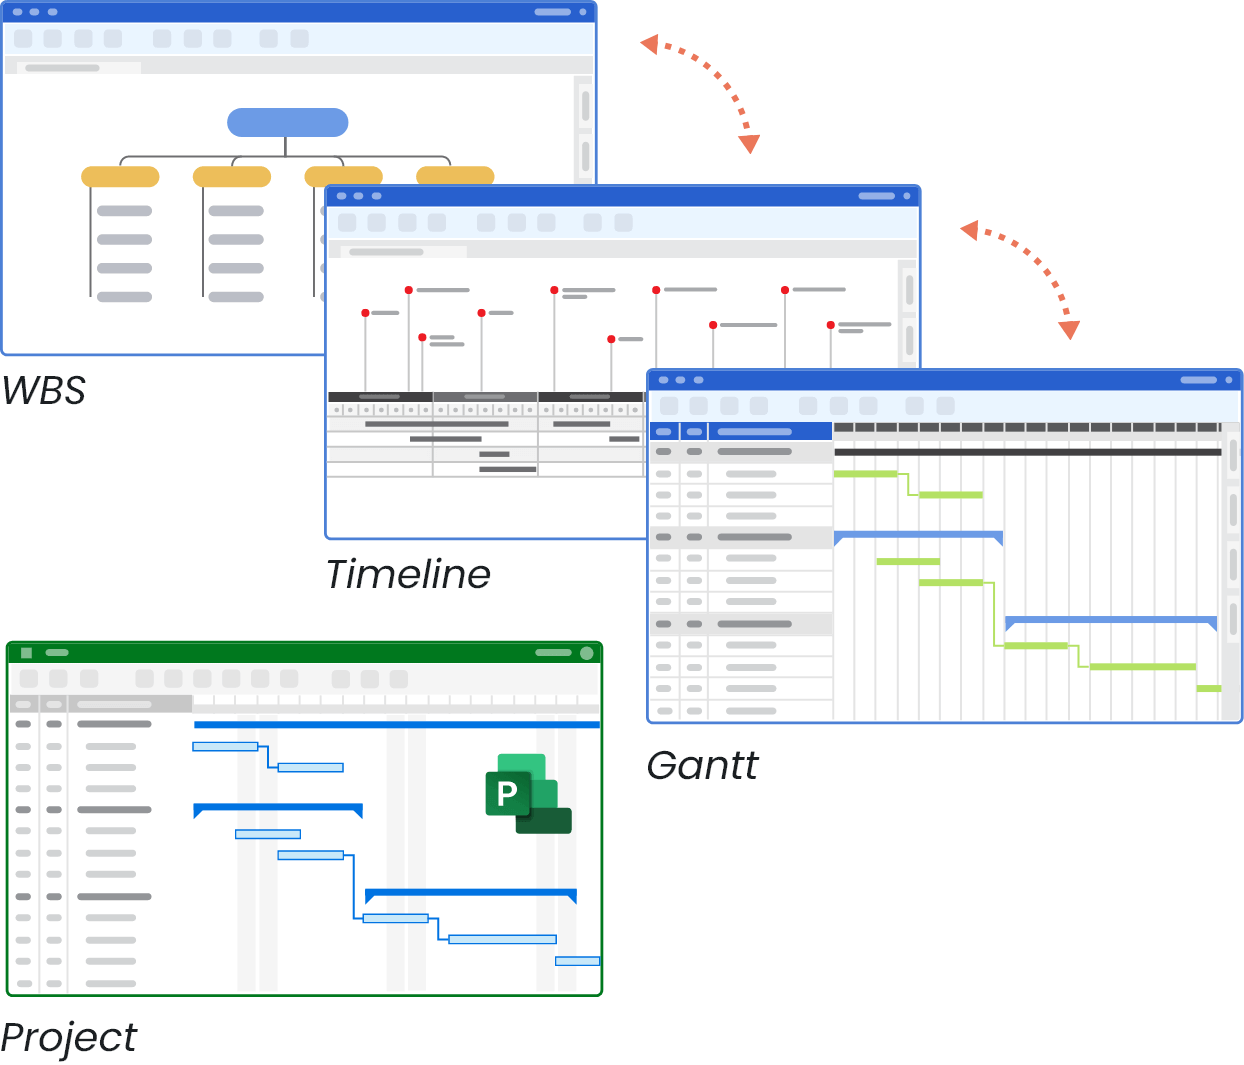
MindView – Powerful Gantt Chart Software

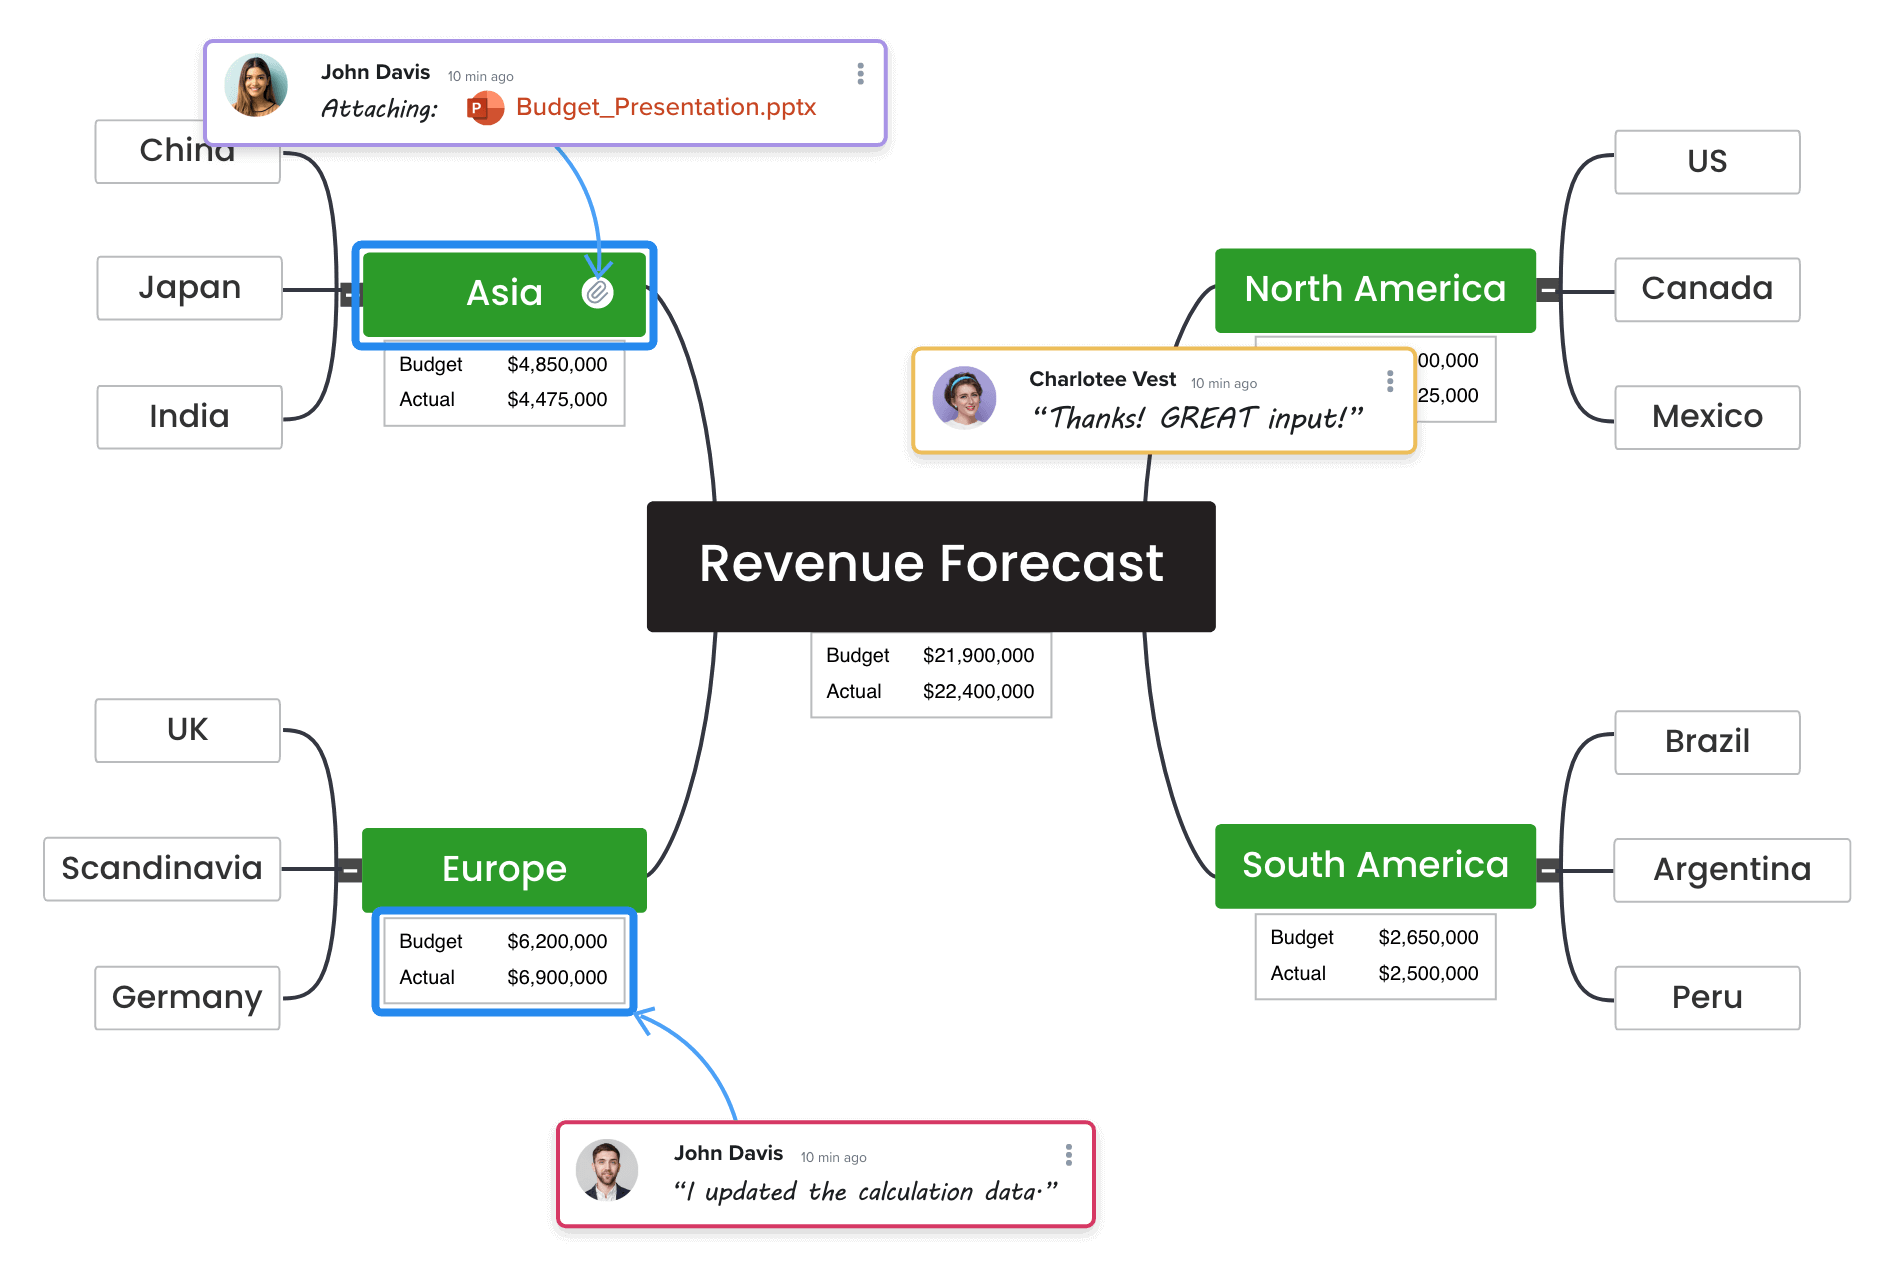
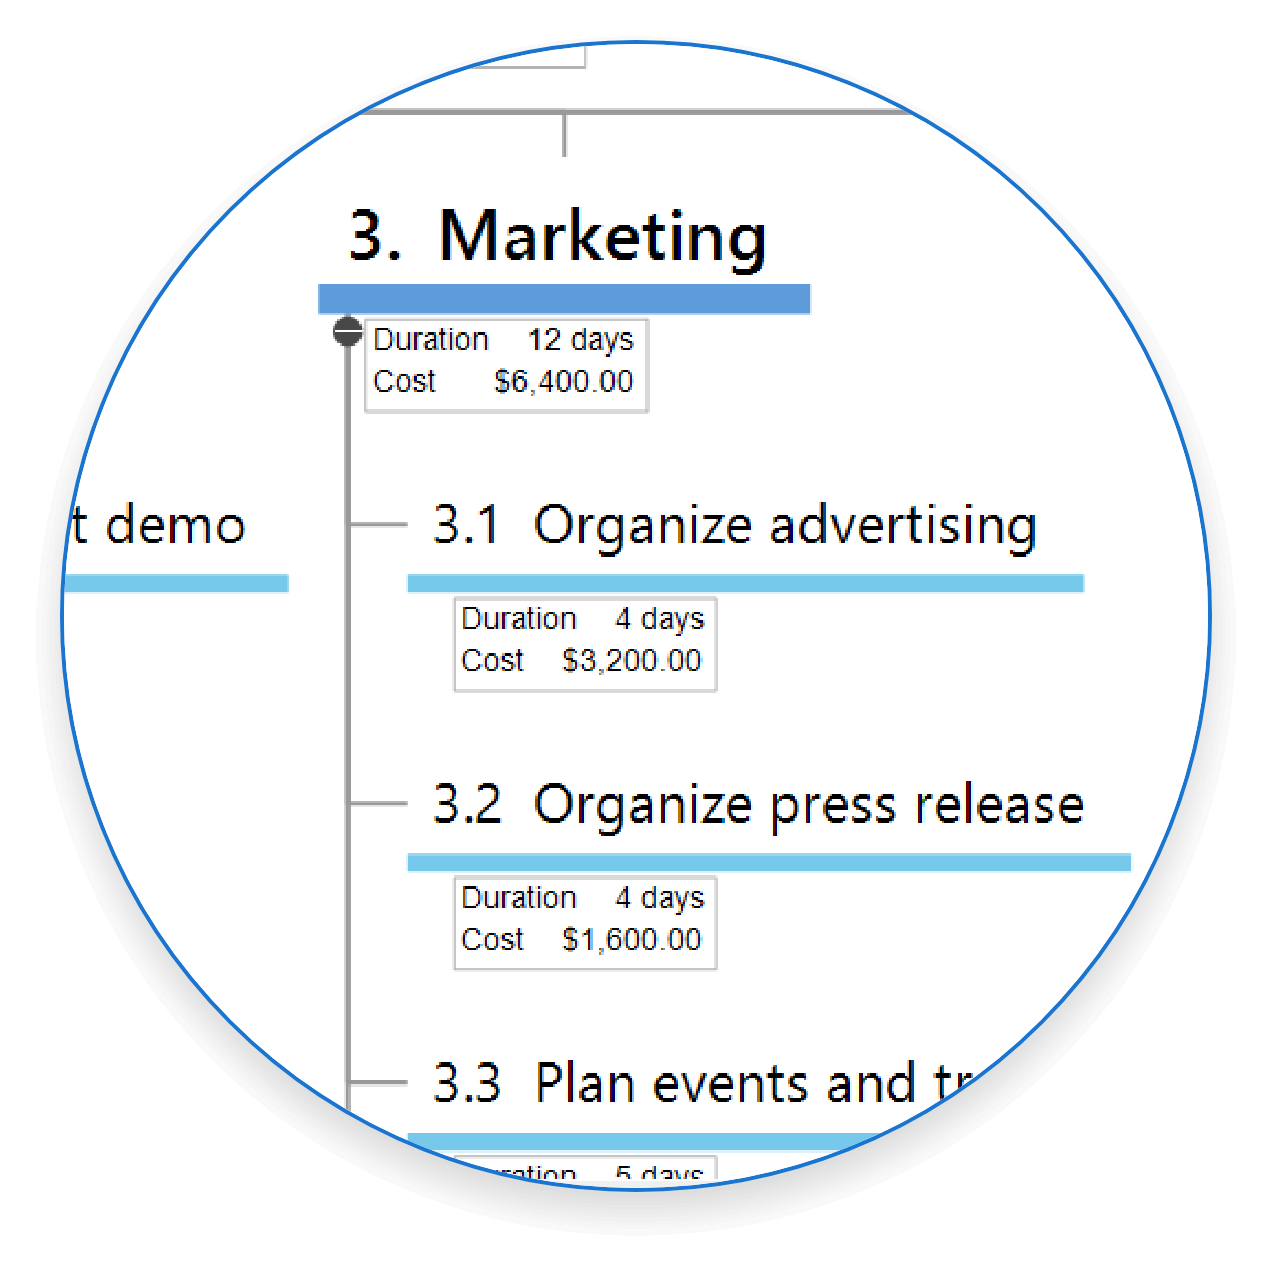
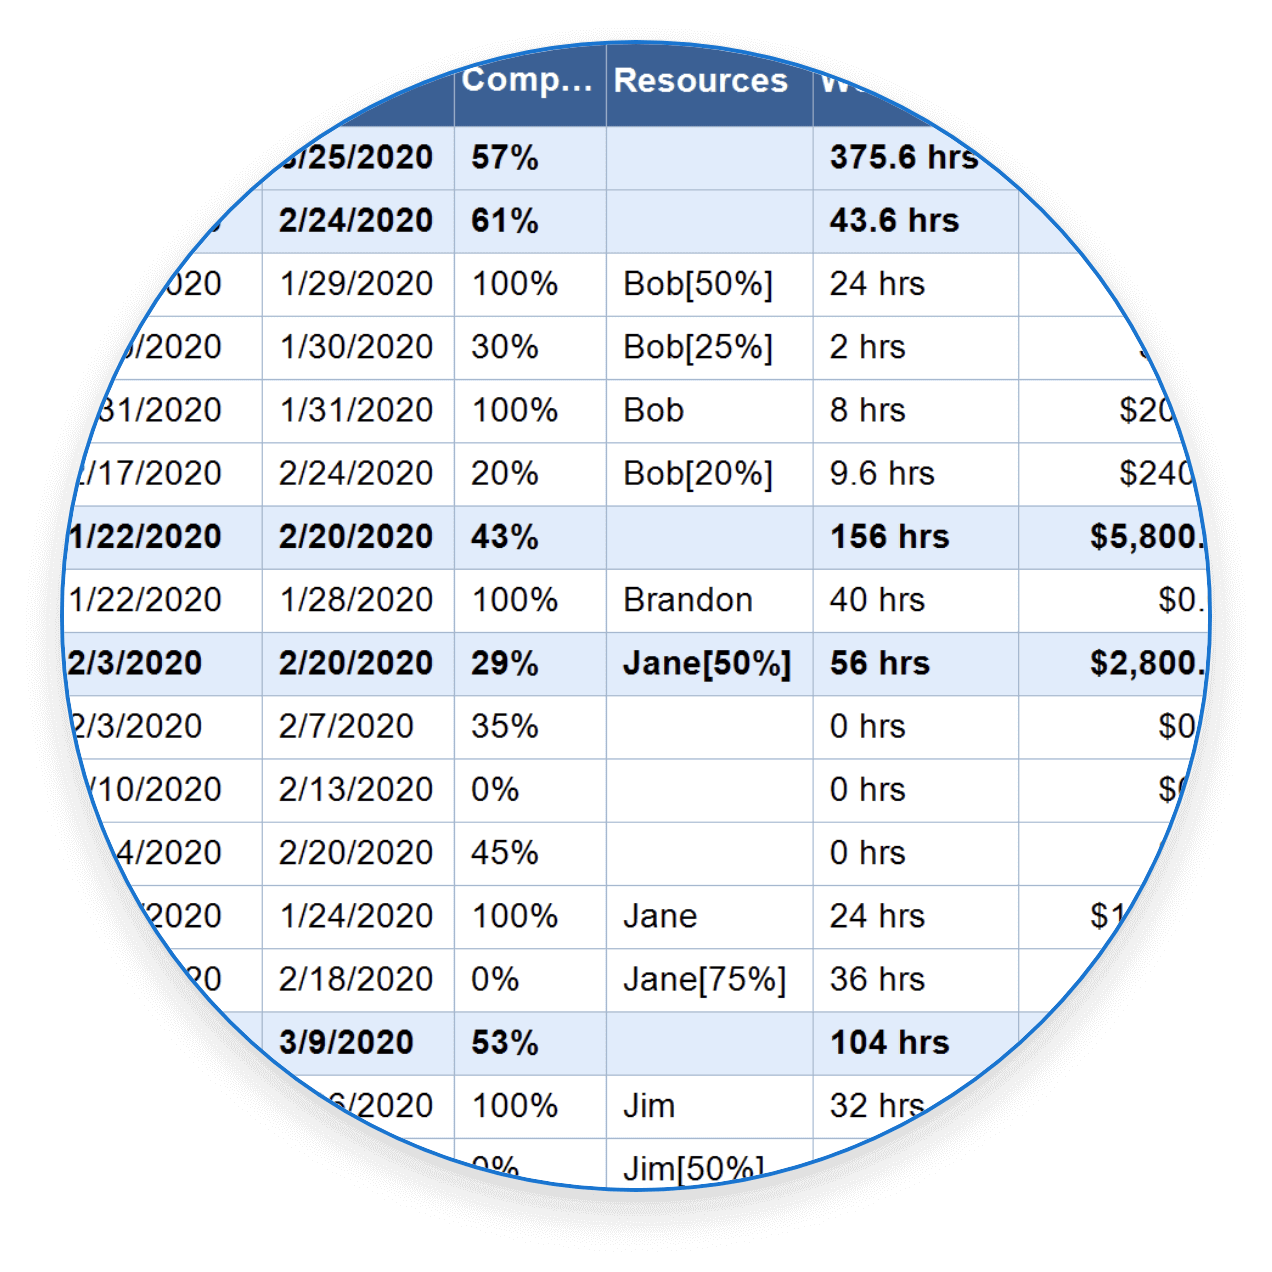
Looking for an effective way to make a Gantt chart? A serious alternative with comprehensive features? With MindView you can create a project plan, collaborate and get things done with ease!

Using MindView to create and manage Gantt Charts for Project Mangement

Key Features

Work Breakdown Structure

Resource Handling

Advanced Gantt Chart

Project Timeline / Roadmap

Microsoft Office Integration

Collaboration

MindView to Manage 600+ 50k – Multimillion Dollar Projects

Read Case Study

See what Stephen Orr, Director, User Experiences Group of AMD thinks about MindView

Read Case Study

Integrating a Work Breakdown Structure with MindView

Read Case Study

Work breakdown structure created in MindView

Work Breakdown Structure Layout

Do you need to start with a WBS to align with your project methodology? MindView comes with the industry leading Work Breakdown Structure view.

  • Simulate your white board and sticky note meeting
  • Capture and reorganize work packages easily
  • Export to Word for your WBS dictionary
  • Swap between the WBS and the Gantt Chart

Fast and easy to use!

Resource handling

Resource Handling

From creating resource pools with specific resource calendars to tracking over-allocation and under-allocation by using effort-driven tasks, we have you covered.

  • Resources and Project Calendars
  • Effort-Driven Tasks
  • Project Reports

It’s all available with a simple mouse click.

Resource handling

Advanced Gantt Chart Functions

Easily enter your tasks and start scheduling your project plan. Use a variety of powerful features to schedule and track your project:

  • Critical path
  • Constraints and predecessor links
  • Milestones
  • Baselines
  • Effort-driven tasks
  • Automated cost calculation

It is all in there…

Advanced Gantt Chart Functions

Project Timeline / Roadmap

Whoever your audience or stakeholders are, we offer a way for you to communicate the project plan:

  • Show your Gantt chart as a timeline
  • Filter on milestones, resources and more
  • Use different roadmap styles

Viewing your project in a different light has never been easier!

Project timelines and roadmaps
MS Office Integration

Microsoft Office Integration

Effortlessly transfer the data to a format sharable through MS Office, and easily import data to create a Gantt chart.

  • MS Office Export/Import
  • Project
  • Excel
  • Word
Collaborate with team mates

Collaboration

Collaborate on the entire process from creating the tasks to tracking the project, bringing transparency to group and project goals.

  • Realtime collaboration regardless of location
  • Assign reading and writing access
  • Automatically track document changes

Don’t be a one-man band, get the team involved.

Collaborate with team mates

How to make a Gantt Chart with MindView

You have two options when making a Gantt chart in MindView:

  1. Start directly in the Gantt Chart
  2. Plan your project in a Work Breakdown Structure and then convert into a Gantt chart

In this example, we will do the latter:

4 steps to make a Gantt Chart

  1. Define work packages and deliverables
  2. Allocate resources
  3. Manage and track the schedule
  4. Communicate the Gantt chart

How to make a Gantt Chart with MindView

Define work packages and deliverables

Define Work Packages and Deliverables

Start by brainstorming your project plan in the Work Breakdown Structure (WBS) or the Mind Map view. Easily enter Deliverables and Work Packages. You can easily re-organize data with drag-and-drop. This is more efficient than the traditional white board or sticky note process. Once you have created the WBS simply swap the data to the Gantt chart view.

  • Easily create a WBS
  • Re-organize work packages with drag-and-drop
  • With a mouse click transfer data from the WBS to Gantt chart
  • WBS can contain task information
Define work packages and deliverables
Apply schedules and resources

Apply Scheduling Information and Resources

Once you have converted to a Gantt chart, your tasks will be visible in the outline to the left of the Gantt chart.

Resources can be entered into the Gantt chart software manually or imported from a saved resource pool. Resources can also be defined as work and material with costs associated with each item.

Start by finetuning your task information with duration, constraints, milestones etc. You can easily rearrange tasks and add tasks in the outline or drag-and-drop elements in the actual Gantt chart.

  • Load pool of resources
  • Apply duration, constraints, milestones
  • Budget costs on resources and materials
Finetune the Gantt Chart

Finetune the
Gantt chart

Consider your workflow and resources to insert dependencies. Use simple drag and drop within the Gantt chart to create dependencies. Use the Project Reports to check for overallocation of resources. You can use Effort Driven tasks too.

Your Critical Path will identify tasks that must be finished on-time to stay on track with your project schedule.

MindView is perfect for managing information from start to finish. Developing dependencies, constraints and milestones helps keep your projects on time and on budget and thus satisfy all stakeholders.

  • Define dependencies and milestones
  • Use project reports to handle overallocation
  • Show critical path
Finetune the Gantt Chart
Present Gantt Charts in multiple formats

Present Your
Gantt Chart

Present your Gantt chart to any stakeholder with a variety of layouts. Swap between the Gantt chart, project timeline, WBS or Project report. Synchronize with Microsoft Project, export to Word or distribute your tasks to resources. MindView has it all included!

  • WBS and Project Timeline included
  • Superior Microsoft Office Integration
  • Integration to Microsoft Project (mpp or xml)
Follow ups and status reports

Follow Up and
Status Reports

After you have completed your project schedule then the following up process begins. This project management software lets you overview project status by utilizing baselines – as many as you like. Project reports are available for costs updating and progress reporting. Getting a project update hasn’t been easier.

  • Baselines
  • Tasks status reports
  • Cost reports
Follow ups and status reports
Try MindView Today!

This website uses cookies to improve user experience. Privacy Policy